
ClusCorr98
Adaptive cluster analysis, classification and multivariate graphics
Methods of cluster analysis, classification and multivariate graphics can be used in order to extract hidden knowledge from huge data sets containing numerical and non-numerical information. Usually this task can be done in a better way by using statistical (mainly explorative) methods based on adaptive distance measures as proposed by Mucha (1992) in Clusteranalyse mit Mikrocomputern, AkademieVerlag, Berlin.
The Statistical Software
The spreadsheet environment of Microsoft Excel hosts the statistical software ClusCorr98. This software is in the Visual Basic for Applications language. Internal and external databases are easily accessed from the Excel environment, see H.-J. Mucha, H. H. Bock (1996): Classification and multivariate graphics: models, software and applications. WIAS Report No. 10, Berlin, and Mucha and Ritter (2009): Classification and clustering: Models, software and applications. WIAS Report No. 26, Berlin. Figure 1 shows a flowchart of an application of cluster analysis to archaeometry.
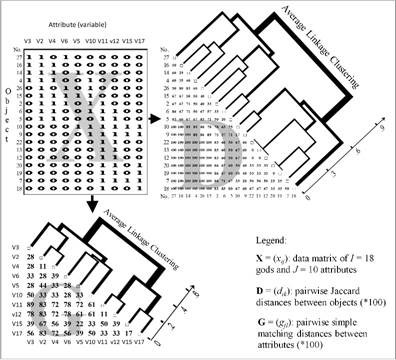
Fig. 1. From data to distances and then finally to results of (hierarchical) clustering.
Model-Based Gaussian Clustering
Model-based Gaussian clustering allows to identify clusters of quite different shapes, see the application to ecology in Figure 2.
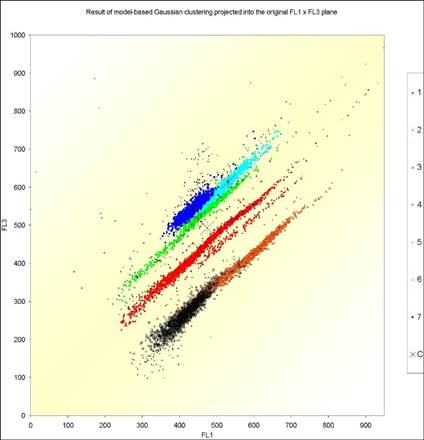
Fig. 2. Application of model-based Gaussian clustering to ecology. For details, see H.-J. Mucha, U. Simon, R. Brüggemann (2002): Model-based Cluster Analysis Applied to Flow Cytometry Data of Phytoplankton. Technical Report 5, WIAS, Berlin.
Parameterizations of the covariance matrix in the Gaussian model and their geometric interpretation are discussed in detail in Banfield and Raftery (1993): Model-Based Gaussian and Non-Gaussian Clustering, Biometrics, 49, 803–821. In the following, as a special approach in big data clustering, let us propose simple Gaussian core-based clustering. The simplest Gaussian model is when the covariance matrix of each cluster is constrained to be diagonal. Let X=(xij) be a data matrix with I row points (observations) and J column points (variables). Then the sum of squares criterion
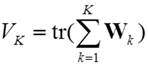 (1)
(1)
has to be minimized, where
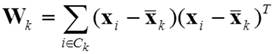 (2)
(2)
For further information please klick here ».
Contact
Phone, E-mail
Tel.: 030 20372-573
E-mail: cluscorr@wias-berlin.de
WIAS Software (Archive)
- awc - Adaptive weights clustering
- BOP - A Simulator for Large-Scale Process Engineering Problems
- ClusCorr98 ® for exploratory data analysis
- DiPoG - Direct and Inverse Problems for Optical Gratings
- gltools for interactive or non-interactive graphical output
- WIAS-MeFreSim - 3D-Simulation of Multifrequency Induction Hardening
- ParMooN - Mathematics and object-oriented Numerics
- WIAS-QW for the simulation of strained multi quantum well structures
- S/PHI/nX library for materials simulation
- WIAS-TeSCA for two and three dimensional semi-conductor analysis