|
|
|
|
[Contents] | [Index] |
Collaborator: S. Jaschke , P. Mathé , G.N. Milstein , H.-J. Mucha , J. Polzehl , J. Schoenmakers , V. Spokoiny
Cooperation with: K. Hahn (GSF-IBB, München), F. Godtliebsen (University of Tromsø, Norway), F. Baumgart (Leibniz-Institut für Neurobiologie, Magdeburg), P. Qiu (University of Minnesota, USA), A. Juditski (INRIA, Grenoble, France), M. Hristache (Université de Rennes, France), W. Härdle (SFB 373, Humboldt-Universität zu Berlin), L. Dümbgen (Medizinische Universität Lübeck), J. Horowitz (University of Iowa, USA), S. Sperlich (University Carlos III, Madrid, Spain), D. Mercurio (Humboldt-Universität zu Berlin), B. Grund (University of Minnesota, USA), O. Bunke, B. Droge, H. Herwartz (SFB 373, Humboldt-Universität zu Berlin), A.W. Heemink (Technische Universiteit Delft, The Netherlands), E. Heimerl (Universität Salzburg, Austria), O. Lepski, J. Golubev (Université de Marseille, France), A. Samarov (Massachusetts Institute of Technology, Cambridge, USA), S.V. Pereverzev (Academy of Sciences of Ukraine, Kiev), R. von Sachs (Université Louvain-la-Neuve, Belgium), S. Zwanzig (Uppsala University, Sweden)
Supported by: DFG: SFB 373 ``Quantifikation und Simulation Ökonomischer Prozesse'' (Quantification and simulation of economic processes), Humboldt-Universität zu Berlin; DFG: Priority Program 1114 ``Mathematische Methoden der Zeitreihenanalyse und digitalen Bildverarbeitung'' (Mathematical methods for time series analysis and digital image processing)
Description: Many interesting applications of statistics in economics, finance, and life sciences are based on large databases and complex, high-dimensional models. In these cases, the first goals of statistical analysis are exploratory data analysis, qualitative description of properties of the data, and dimension reduction for further analysis.
Statistical inference includes various methods in statistical modeling, goodness-of-fit tests, and tests of significance for properties identified in the exploratory data analysis.
1. Adaptive techniques for image processing (J. Polzehl, V. Spokoiny).
Large amounts of two- or three-dimensional images are generated in many fields including medicine, environmental control, meteorology, geology, and engineering. Often decisions have to be based on certain features in the image. To do this the quality of noisy images has to be improved and the features have to be identified. Examples are satellite images, tomographic images, magnetic resonance images (MRI), and ultrasonic images.
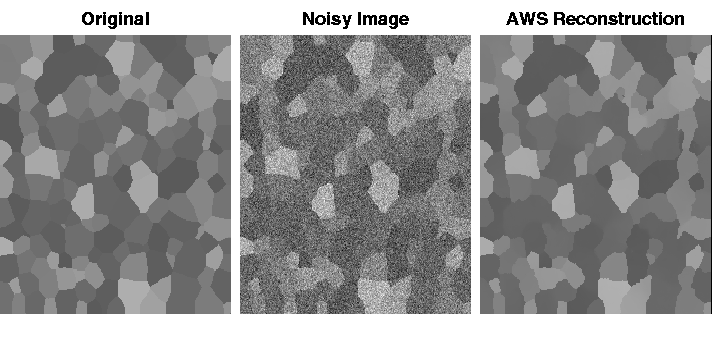
Within the project we have developed two new adaptive smoothing techniques, pointwise adaptation and adaptive weights smoothing . The first method, described in [32], allows to estimate grey-scale images that are composed of large homogeneous regions with smooth edges and observed with noise on a gridded design. The procedure searches, in each point, for the largest vicinity of the point for which a hypothesis of homogeneity is not rejected. Theoretical properties of the procedure are studied for the case of piecewise constant images. We present a nonasymptotic bound for the accuracy of estimation at a specific grid point as a function of the number of pixel, of the distance from the point of estimation to the closest boundary, and of smoothness properties and orientation of this boundary. It is shown that the proposed method provides a near optimal rate of estimation near edges and inside homogeneous regions.
The second method, Adaptive Weights Smoothing (AWS) (see [33]), is based on the idea of structural adaptation . The method employs the structural assumption of a specified local model within an iterative procedure. The resulting method has many desirable properties like preservation of edges and contrast, and (in some sense) optimal reduction of noise. The method considerably improves on classical smoothing procedures as soon as the local model provides a reasonable approximation to the image.
Fig. 1 illustrates the reconstruction of a local constant image from a noisy version.
|
|
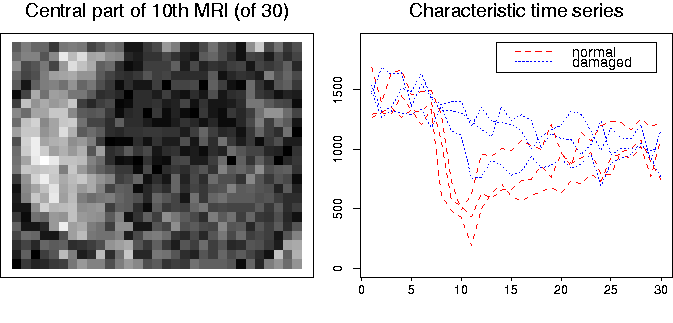
The idea underlying AWS can be applied to many other types of data. We shortly present an application to classification in dynamic MRI, see [34]. The data, illustrated in Fig. 2, consist of 30 MR images showing, in each voxel, the effect of a contrast agent over time.
The different behavior in pathologic areas provides
the necessary contrast for tissue classification. In this context a vectorized version
of AWS can be used to improve tissue classification by adaptive spatial smoothing.
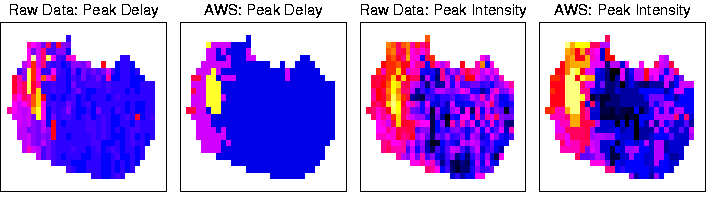
Fig. 3 shows the results without (raw data) and with
(AWS) spatial adaptive smoothing for
two classification criteria.
Currently several generalizations of the structural approach are under development. This especially includes local polynomial adaptive smoothing, varying coefficient models and likelihood-based methods, e.g., for binary response models.
Research in this field is supported by the DFG Priority Program 1114.
2. Effective dimension reduction (J. Polzehl, V. Spokoiny).
In many statistical problems one is confronted with high-dimensional data. Typical examples are given by econometric or financial data. For instance, usual financial practice leads to monitoring about 1000 to 5000 different data processes. Single- and multi-index models are often used in multivariate analysis to avoid the so-called ``curse of dimensionality'' problem (high-dimensional data are very sparse). Such models generalize classic linear models and they can be viewed as a reasonable compromise between too restrictive linear and too vague pure nonparametric modeling. For the corresponding analysis, the targets are typically index vectors which allow to reduce the dimensionality of the data without essential loss of information. The existing methods of index estimation can be classified as direct and indirect. The indirect methods like the nonparametric least-squares estimator, or nonparametric maximum-likelihood estimator have been shown to be asymptotically efficient, but their practical applications are very restricted. The reason is that calculation of these estimators leads to an optimization problem in a high-dimensional space, see [17]. In contrast, direct methods like the average derivative estimator, or sliced inverse regression are computationally straightforward, but the corresponding results are far from being optimal, again due to the ``curse of dimensionality'' problem. Their theory applies only under very restrictive model assumptions, see [36], [35] and [4].
Another direct method of index estimation for a single-index model is proposed in [14]. This method can be regarded as a recursive improvement of the average derivative estimator. The results show that after a logarithmic number of iterations, the corresponding estimator becomes root-n consistent. The procedure is fully adaptive with respect to the design and to unknown smoothness properties of the link function, and results are valid under very mild model assumptions.
For the multi-index situation,
[15]
proposed a new method of dimension reduction
which extends the procedure from [14] and is based on the idea
of structural adaptation.
The method applies for a very broad class of regression models
under mild assumptions on the underlying regression function
and the regression design.
The procedure is fully adaptive and does not require any prior
information.
The results claim that the proposed procedure delivers the optimal
rate ![]() of estimating the index space provided
that the effective dimensionality of the model is not larger than 3.
The simulation results demonstrate an excellent performance of the
procedure for all considered situations.
An important feature of the method is that it is very stable
with respect to high dimensionality and for a non-regular design.
of estimating the index space provided
that the effective dimensionality of the model is not larger than 3.
The simulation results demonstrate an excellent performance of the
procedure for all considered situations.
An important feature of the method is that it is very stable
with respect to high dimensionality and for a non-regular design.
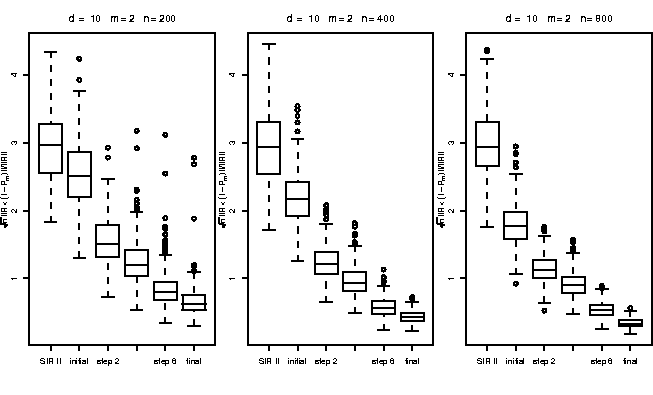
Fig. 4
illustrates the results of a simulation study using a bi-index model
![]() with
Gaussian errors
with
Gaussian errors ![]() .The box-plots display the values of a numerical criterion characterizing
the quality of the estimated
index space for a covariance-based SIR, the ``best'' one-step estimate and
after the first, second, fourth, eighth,
and final iteration for
.The box-plots display the values of a numerical criterion characterizing
the quality of the estimated
index space for a covariance-based SIR, the ``best'' one-step estimate and
after the first, second, fourth, eighth,
and final iteration for ![]() ,
, ![]() , and different sample size
, and different sample size
![]() . The results displayed are
obtained from N=250 simulations.
. The results displayed are
obtained from N=250 simulations.
|
3. Statistical inference for time-inhomogeneous finance time series (J. Polzehl, V. Spokoiny).
Log-Returns ![]() of the price or currency process in the speculative market
are typically modeled using the
Conditional Heteroscedasticity
assumption:
of the price or currency process in the speculative market
are typically modeled using the
Conditional Heteroscedasticity
assumption:
![]()
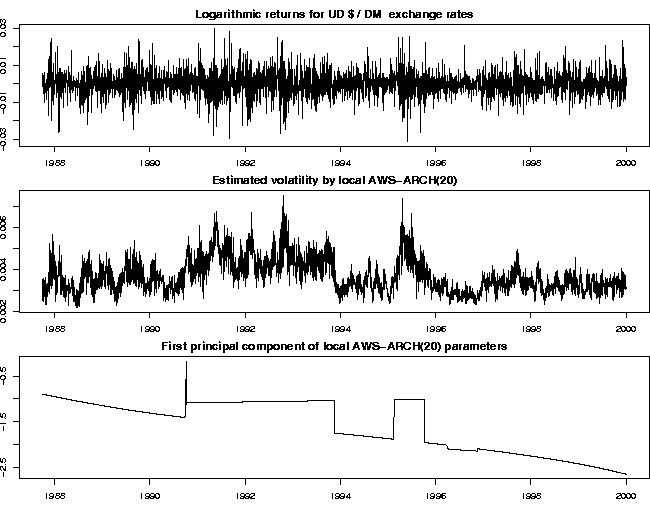
The paper [7] offers an extension of the proposed method to multiple volatility modeling for high-dimensional financial data. The approach involves data transformation, dimension reduction , and adaptive nonparametric smoothing as building blocks.
Fig. 5 demonstrates the results of an adaptive weights smoothing procedure for time series using the structural assumption of a local ARCH(20) model for the logarithmic returns of the US $ / DM exchange rates in the period 1988-2000. The bottom plot illustrates the segmentation into homogeneous time intervals obtained by the procedure.
4. Robust nonparametric hypothesis testing (J. Polzehl, V. Spokoiny).
Linear quantile regression models are often used in applications. See [2], [18], [20], among others. In contrast to mean regression models, quantile regression models do not require the individual errors to have moments, are robust to outlying values of the observations, and permit exploration of the entire conditional distribution of the dependent variable. However, there has been little research on testing the hypothesis of linearity. To our knowledge, only [38] and [1] have developed tests of parametric quantile regression models against nonparametric alternatives. In contrast, there is a broad range of literature on testing mean regression models against nonparametric alternatives, see [12] and the references therein.
Paper [13] proposed a new test of the hypothesis that a conditional median
function is linear against a nonparametric alternative. The test
adapts to the unknown smoothness of the alternative model, does not
require knowledge of the distribution of the possibly heterogeneous
noise components of the model, and is uniformly consistent against
alternative models whose distance from the class of linear functions
converges to zero at the fastest possible rate. This rate is slower
than ![]() . In addition, the new test is consistent
(though not uniformly) against local alternative models whose distance
from the class of linear models decreases at a rate that is only
slightly slower than
. In addition, the new test is consistent
(though not uniformly) against local alternative models whose distance
from the class of linear models decreases at a rate that is only
slightly slower than ![]() . The results of Monte Carlo
simulations and an empirical application have illustrated the
usefulness of the new test.
. The results of Monte Carlo
simulations and an empirical application have illustrated the
usefulness of the new test.
In the semiparametric additive hazard regression model of McKeague and Sasieni ([24]) the hazard contributions of some covariates are allowed to change over time while contributions of other covariates are assumed to be constant. In [6] bootstrap-based test procedures for parametric hypotheses in nonparametric additive survival models are developed, which can be used to identify covariates with constant hazard contributions.
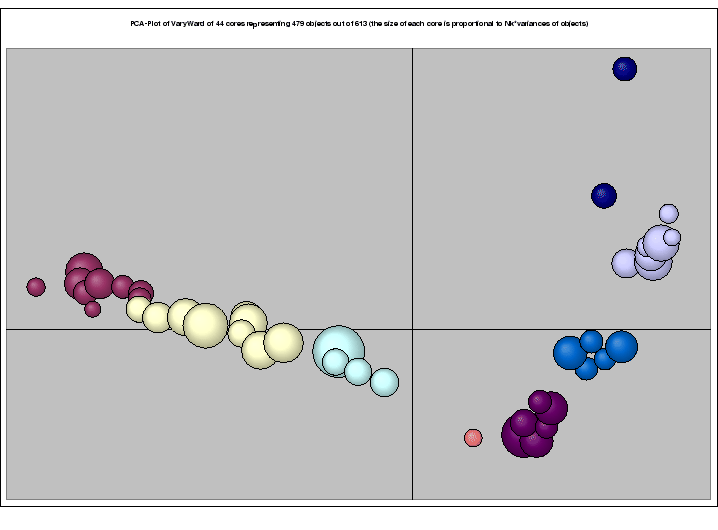
5. Cluster analysis, multivariate graphics, data mining (H.-J. Mucha).
Clustering, in data mining, aims at finding interesting structures or clusters directly from the data without using any background knowledge. The notion of cluster analysis encompasses a great family of methods. Synonyms in use are numerical taxonomy (because of its biological roots), automatic classification, and unsupervised learning. There are model-based as well as heuristic clustering techniques. At most one will set up new hypotheses about the data. At least they aim at a practical useful division of a set of objects into subsets (groups, clusters). This task of subdivision can be attained at the lowest level simply by reordering or sorting techniques. In any case, high-dimensional data visualization (multivariate graphics, projection techniques) and matrix reordering techniques are very useful for visualizing structures and clusters within data ([28]). This indeed is a highly recommended way for a better understanding of both the multivariate high-dimensional data and the results of clustering.
Our statistical software ClusCorr98® performs exploratory data analysis mainly by using adaptive methods of cluster analysis, classification, and multivariate graphics. Having data mining applications in mind, some new cluster analysis tools are under development. For example, new model-based clustering techniques using cores are based on weighted observations in order to handle huge data sets effectively ([3]). Intelligent clustering based on dual scaling can handle mixed data. ClusCorr98® is written in Visual Basic for Applications (VBA) ([29]). It runs under Microsoft Windows taking advantage of the Excel environment including its database facilities.
|
6. Numerical analysis of statistical ill-posed problems (P. Mathé).
Ill-posed equations arise frequently in the context of inverse problems, where it is the aim to determine some unknown characteristics of a physical system from data corrupted by measurement errors. Unless special methods, such as Tikhonov regularization, are used, it is often impossible to get sensible results.
In collaboration with S.V. Pereverzev this area of problems is studied for statistical problems
![]()
![]()
Modern numerical analysis has developed a rich apparatus, which
reflects different aspects of the sensitivity of ill-posed problems.
In Hilbert scales such problems were systematically analyzed since
Natterer ([30]).
Sometimes, this restriction does not give a flexible
approach to estimating realistic convergence rates. Moreover, some
important cases are not covered by the ordinary Hilbert scale theory.
For these reasons variable Hilbert scales were introduced by
Hegland ([9]).
Within this framework the solution smoothness is expressed in terms
of so-called general source
conditions, given by some function over the modulus of the operator A
involved in the ill-posed equation. These allow to describe local
smoothness properties of the solution.
Roughly speaking, in a Hilbert scale with generator L, the norm
![]() is replaced by
is replaced by
![]() , where
, where
![]() is some non-negative function (on the spectrum) of L.
is some non-negative function (on the spectrum) of L.
The analysis of ill-posed problems in variable Hilbert scales was further developed in [10] and [37]. In this project the following problems were analyzed.
For certain source conditions (power functions or logarithms), first answers were known, see [19], [11], and [31]. In [23] the role of certain geometric properties of the source condition, in particular their concavity, was analyzed.
7. Statistic and Monte Carlo methods for estimating transition densities for stochastic differential equations (SDEs) (G. Milstein, J. Schoenmakers, V. Spokoiny).
In many applications, for instance in financial and environmental modeling, it is useful to have an efficient algorithm to determine the transition density of a, for example, financial or environmental process given by a stochastic differential equation,
![]()
In a cooperation project with
``Applied mathematical finance'' and ``Numerical methods for
stochastic models'' we
constructed a Monte Carlo estimator for
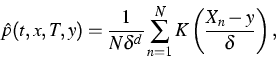
the unknown transition density p(t,x,T,y) for fixed t,x,T,y, which
improves upon classical kernel or projection estimators based on approximate
realizations of Xt,x(T) directly. For example, the kernel
(Parzen-Rosenblatt) density estimator with a kernel K and a bandwidth ![]() is given by
is given by
|
Further, in [16] we proposed asymptotically efficient procedures for estimating the linearized drift of SDEs. Some extremal problems related to nonparametric maximum likelihood estimation of a signal in white noise are investigated in [26].
References:
|
|
|
[Contents] | [Index] |